RBENREJEB@RBR-OS:/OPT/DATAFORM-INTELLIJ-PLUGIN/FEATURES/LINEAGE$ CAT README
Lineage
Dataform Plugin for IntelliJ · Features
The plugin draws the dependency graph of your Dataform actions from the compiled project, and the
column-to-column lineage from the compiled SELECT statements. Two views show it: the file lineage
next to a SQLX file, and the project lineage of the whole pipeline.
Lineage needs a compiled project. If the graph is empty, the view asks you to compile the Dataform project first.
File lineage
Open a SQLX file and select the Lineage view in the split editor toolbar, at the top right of the editor. The panel shows the direct dependencies of the file: the actions it reads from on one side and the actions that read from it on the other.
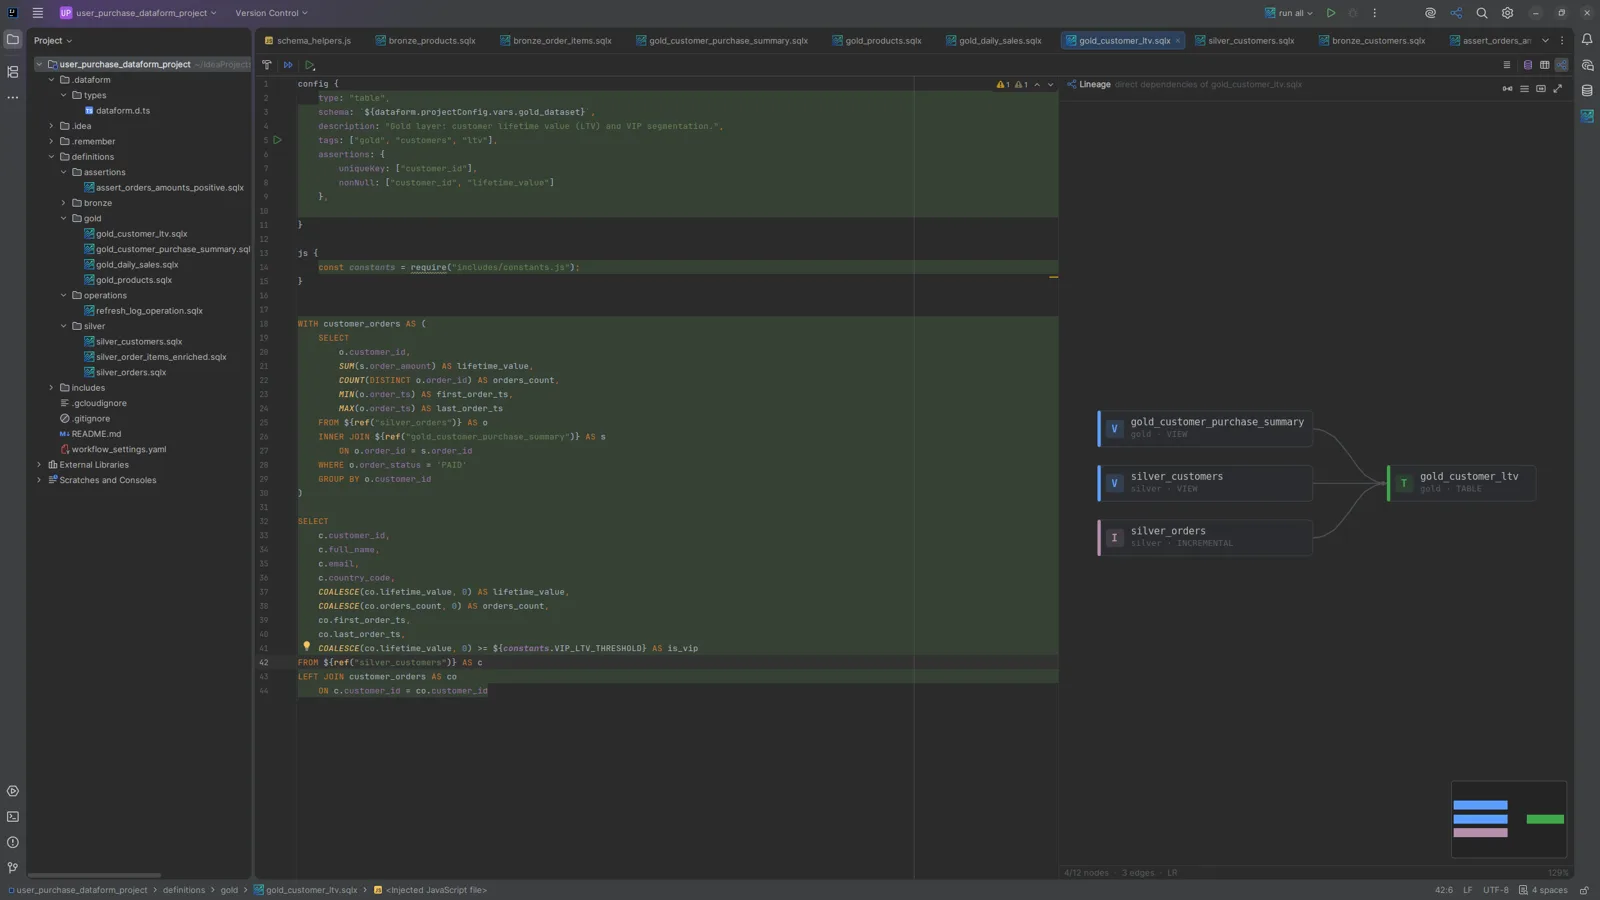
Its toolbar lets you:
- switch the layout direction between left-to-right and top-to-bottom;
- switch the node density between comfortable and compact;
- Fit to view;
- Open full lineage, the project lineage described below.
Project lineage
Open the project lineage with Tools ▸ Open Dataform Lineage, the lineage icon in the main
toolbar, the editor or Project view context menu, or Alt+Shift+D. It opens in an editor tab named
Dataform Lineage.
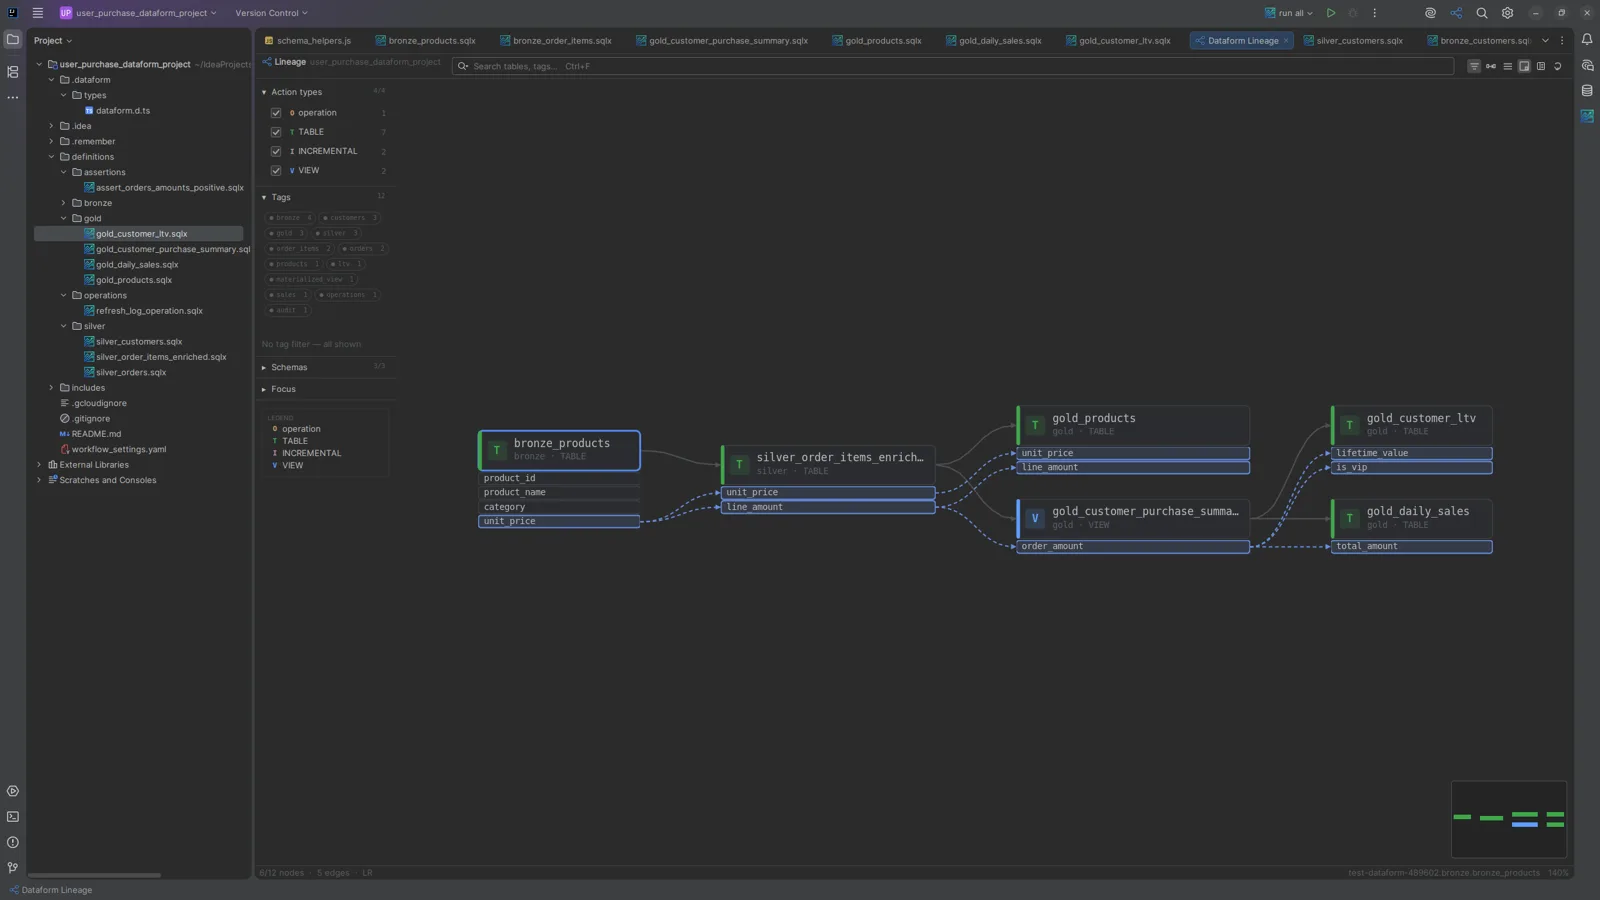
The view has three parts:
- the filters sidebar on the left;
- the graph, with a minimap in the bottom right corner and a status bar showing the number of visible nodes and edges;
- the details panel on the right, for the selected node or column.
Toolbar
| Control | Action |
|---|---|
Search (Ctrl+F) |
Filter the graph by table name or tag. |
| Toggle filters | Show or hide the filters sidebar. |
| Direction | Lay the graph out left-to-right or top-to-bottom. |
| Density | Compact or comfortable nodes. |
| Minimap | Show or hide the minimap. |
| Details | Show or hide the details panel. |
| Re-layout | Recompile the project and refresh the lineage. |
Navigating the graph
- Scroll the mouse wheel to zoom and drag the background to pan. The minimap shows where you are in the graph.
- Click a node to select it. The details panel shows its type, schema, file, tags and its upstream and downstream actions, with buttons to Focus on lineage, Open SQL and Run the action.
- Double-click a node to open its source file.
- Right-click a node for Focus on lineage, Select node, Open source and Copy qualified name.
Filters
The filters sidebar narrows the graph down:
- Action types: show or hide operations, tables, incremental tables and views. Each type has its
own colour and letter (
O,T,I,V), recalled in the legend. - Tags: show only the actions carrying the selected tags.
- Schemas: show or hide the actions of each BigQuery dataset.
- Focus: the action the graph is focused on, if any.
Focus
Focus on lineage keeps only the selected action and everything upstream and downstream of it, which makes a large pipeline readable. Exit focus brings the full graph back.
Column lineage
Click a node that has a known schema to expand its column list, then click a column. The graph
highlights the column and draws dashed edges to the columns it comes from and the columns derived
from it, across the whole pipeline. In the screenshot above, unit_price of bronze_products flows
into silver_order_items_enriched, then into line_amount, order_amount, lifetime_value and
total_amount downstream.
Ctrl+Clickadds or removes a column from the selection, to follow several columns at once.- The details panel lists the Upstream columns and Downstream columns of the selected column.
- Edges whose source column cannot be determined with certainty are drawn differently from direct ones.
Column lineage uses the table schemas resolved through BigQuery dry runs, so it needs you to be signed in with a repository configured (see Configuration). When some schemas cannot be resolved, a banner warns that the column lineage may be incomplete and names the tables concerned.